For the last two years, Bridge12 has been developing the Python package DNPLab in collaboration with the Franck lab at Syracuse University and the Han lab at the University of California, Santa Barbara. The purpose of this package is to make importing, processing and analyzing DNP-NMR data more convenient.
DNPLab is an open source package, distributed under the MIT license and the documentation is available at http://dnplab.net/.
The package can be easily installed using pip by running the following command:
pip install dnplab
DNPLab is under constant development and a new, updated version is typically released on the first and third Friday of a month.
Introducing DNPLab Feature Notes
To demonstrate the capabilities of DNPLab we are planning to release short feature notes every second and fourth Friday of the month here on the Bridge12 DNP Blog.
The first DNPLab Feature Note gives a short example how to import, process and plot NMR data.
Importing and Plotting NMR Data
DNP instruments can range from home-built instruments to complete, commercial solutions from a single vendor. However, any possible combination in between exists too (e.g. home-built Overhauser DNP spectrometers). DNPLab supports importing NMR data from a variety of vendors:
- Bruker - TopSpin
- Varian/Agilent - VnmrJ
- Magritek - Key, Spinsolve
- Tecmag - T-NMR
- JEOL - Delta
In this short example, we show how to import NMR data from an NMR spectrometer running TopSpin. First let’s setup the python environment:
import dnplab as dnp
import matplotlib.pylab as plt
Next, let’s import the NMR time domain data set
data = dnp.load("../../data/topspin/1")
data.attrs["experiment_type"] = "nmr_spectrum"
Here, the user does not have to supply the type of spectrometer that is used for recording the data. DNPLab will automatically detect that the spectrum was recorded using TopSpin. The package uses object oriented programming and the data is imported as a dnpdata object.
The experiment type is stored as an attribute of the dnpdata object. In this example it is simply nmr_spectrum. This attribute is later used to streamline the behavior of DNPLab when plotting the processed spectrum.
Next, we will perform same basic processing, namely apply a linewidht function of 100 Hz prior to Fourier Transforming the time domain data. This is followed by auto-phasing the spectrum.
data = dnp.apodize(data, lw=100)
data = dnp.fourier_transform(data)
data = dnp.autophase(data, force_positive=True)
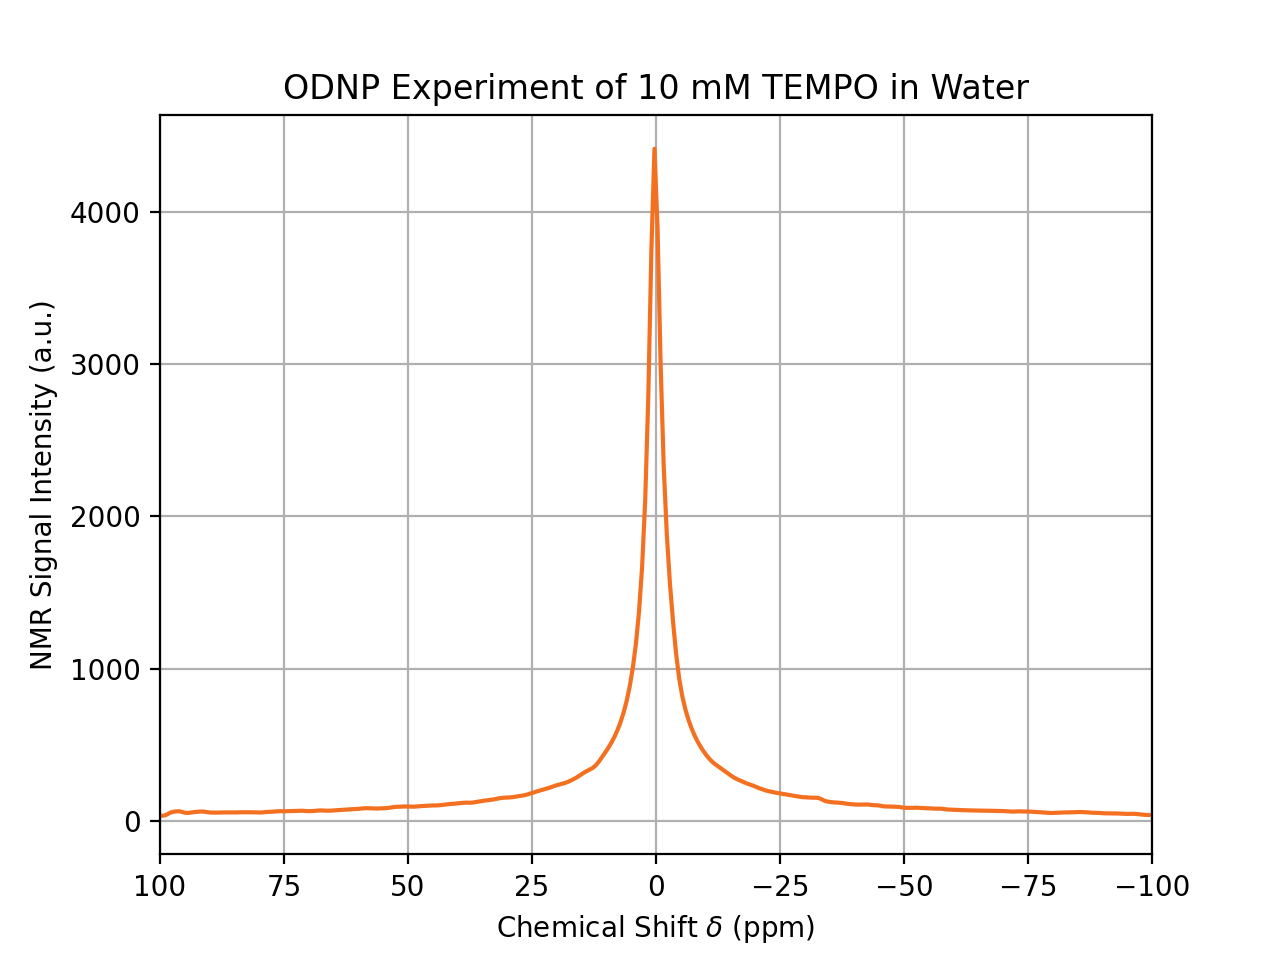
The spectrum is imported, and processed. Now let’s plot the spectrum:
sampleTag = "ODNP Experiment of 10 mM TEMPO in Water"
dnp.fancy_plot(data, title=sampleTag)
dnp.plt.show()
 That’s it. The processed NMR spectrum is shown in a format ready for the next Power Point presentation. Here, we also make use of the variable sampleTag, which is used as the title of the spectrum.
For more processing tips and tricks check out the DNPLab Documentation, or the specific example of Load 1D Spectrum.