DNPLab is an object-oriented Open Source Python-based package for importing, processing, and analyzing data determined in a Dynamic Nuclear Polarization (DNP-NMR) experiment. The aim of the project is to provide a free, turn-key python-based processing package DNP-NMR data. For more information visit:
- the GitHub repository,
- the Online Documentation,
- or follow us on Twitter for updates.

Dynamic Nuclear Polarization (DNP) spectroscopy combines Nuclear Magnetic Resonance (NMR) and Electron Paramagnetic Resonance (EPR) techniques and the two methods go hand in hand. To fully understand the DNP properties of a polarizing agent it is crucial to understand the EPR spectrum of it.
Many EPR experiments are performed at X-Band frequencies (9.5 GHz) and although the method is technically older than NMR spectroscopy, simply plotting a spectrum recorded on a commercial instrument often requires proprietary software - an unnecessary hurdle. Yes, the Python wizards will find a way to import the data and plot it, but why not have a convenient way for the scientist who wants to focus on the results?
Besides importing NMR data files, the import function of DNPLab can also import EPR data in different formats. Currently, DNPLab supports the following formats:
- Bruker WinEPR
- Bruker EMX
- Bruker Xepr
- Specman4EPR
Plot EPR Spectra
To load and plot an EPR spectrum in DNPLab only two lines of code are required after you imported DNPLab:
import dnplab as dnp

data = dnp.load("1D_CW.DTA")
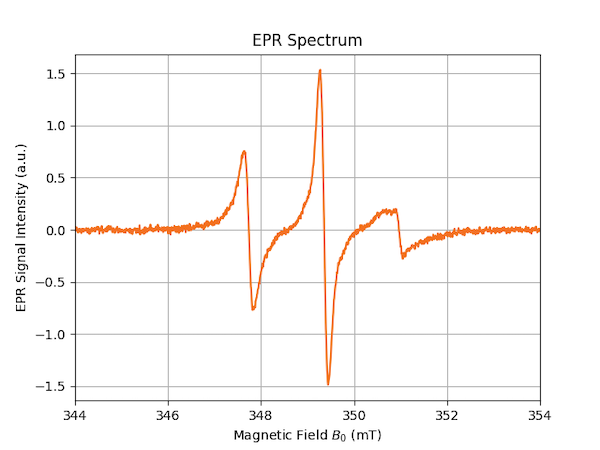
dnp.fancy_plot(data_proc, xlim=[344, 354], title="EPR Spectrum")

That’s it. You created an almost publication-ready figure (however, not the prettiest EPR spectrum I have seen in my life … but the data was handy).
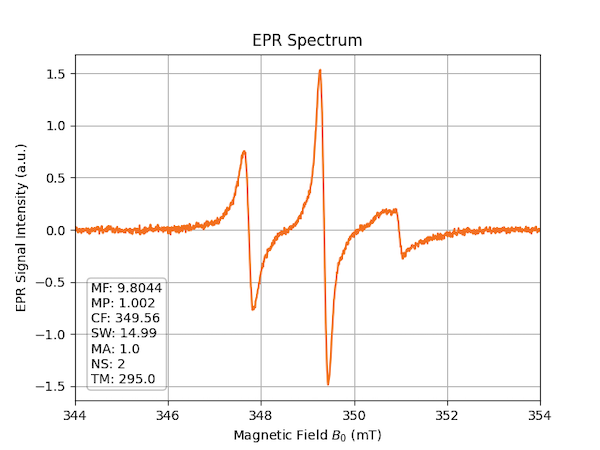
Sometimes, you just want to look up the experimental parameters that were used to record the spectrum. For this, just set the flag showPar to True and plot the spectrum:
dnp.fancy_plot(data_proc, xlim=[344, 354], title="EPR Spectrum", showPar=True)

Common parameters are printed in a textbox, e.g. microwave frequency (MF), the modulation amplitude (MA), or the number of scans (NS).
For more processing tips and tricks check out the DNPLab Documentation, or the specific example of Load EPR Spectrum or follow us on Twitter for updates.
